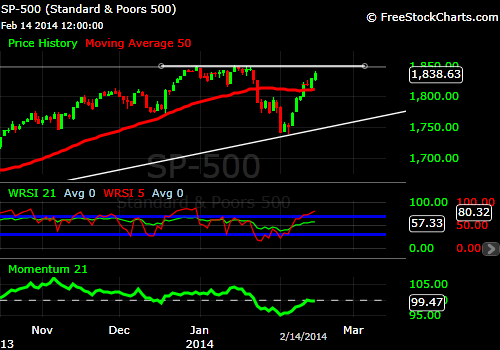
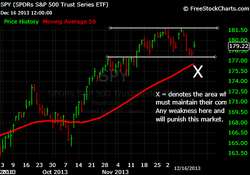
A statement was made by the Bulls: "Buy The Freaggin Dip!" ("BTFD). In the last week of January'14 price moved below the 50-Day MA and the bias shifted to the downside, but the Bulls managed to use $1740 as the "buy zone" to launch a relentless and punishing campaign to hurt short sellers. One could almost hear the moans and groans coming from those that failed to "BTFD".
Currently price sits atop the value area (50-Day MA), but the bias is still to the downside (bias shift determined by Novy Principles of Market Flow). No doubt this was a relentless show of effort by the Bulls to maintain control; however, is it enough to overcome the previous "line in the sand" at 1850? I must admit I didn't think the Bulls could push price above the confluence of resistance at 1810: 50-Day MA; 61.8% resistance level; and old resistance level, but they moved through without any trouble. Nevertheless, price still reigns king and Bulls need to move price through 1850 to convince me that this price action is real buying and not short covering.
Bias: DOWN
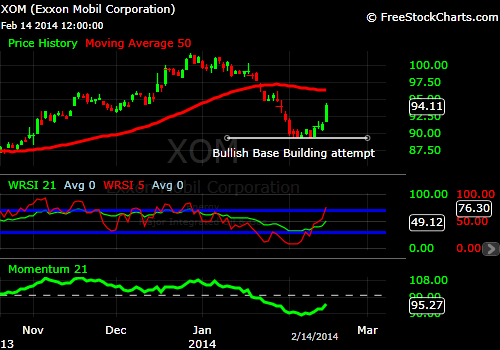
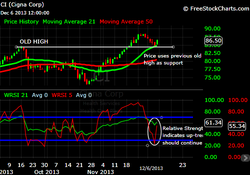
The chart below is a good example of what I've laid out in in the Trader Philosophy section. This example in $XOM is a picture of price action that formed a bullish base building area in the $89.30-.40 area. Bears are opportunists and cannot cause price to go lower. As the shorts kept finding buyers below, the market was not able to move lower. For $XOM to have moved lower in that area, the entire thought process had to change from greed to fear before the bulls let go of their positions. The Bulls gained confidence and used the area to "BTFD".
This successful base building effort resulted in price moving higher, but it faces a test of resistance at the value area (50-Day MA). Now as we test the value area and [possibly] roll-over lower to come back and test the base building area, it will be critically important for Bulls to show their commitment to that price level. Bears will most certainly enter the market if they see the commitment level of bulls waning and any weakness at the former base building area (89.30-.40), will result in lower prices.
 RSS Feed
