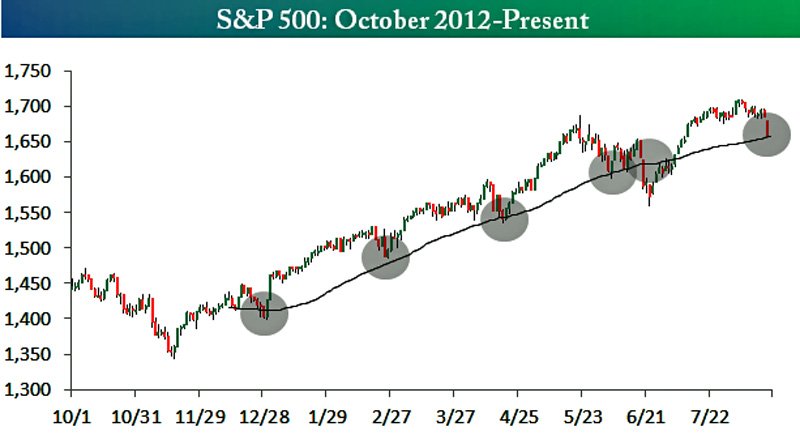
As what most are calling “corrective activity” occurring in world financial markets, there are some ominous signs that should cause Bullish traders to shift their mindset from the typical cavalier, buy-the-dip mentality to a more cautious mindset. For one, on the SP 500 ($ES_F) price has closed below the 50-Day Moving Average on four consecutive occasions (as of this writing) . When price encounters the 50-Day Moving Average, price should instantly move away and continue the ongoing trend. When price consolidates and hesitates around this widely popular benchmark, it can be a sign of indecision and position adjustment by traders, signaling a change in trend. See Figure 1. The 50-Day Moving Average is perceived to be the dividing line between a stock (or index) that is technically healthy and one that is not. Furthermore, it has been said that the percentage of stocks above their 50-Day Moving Average helps determine the overall health of the market.
Figure1. Courtesy of Bespoke Investment Group
Figure1. Courtesy of Bespoke Investment Group
Other factors that may be contributing to the profit taking can be attributed to the weak or lackluster earnings reports; fears of an increase in interest rates; “Taper Talk” and the potential adjustment to the Quantitative Easing (QE) program by the Federal Reserve; turmoil in Egypt; and anything else that media pundits want to throw in the mix. I’ll leave the fundamental reasons of the market “corrective action” to the experts. I’m simply watching the technical price action. And the price action of late signals “caution”.
 RSS Feed
