This market needs commitment! As major indices reached the level of euphoria of all time highs circa 11/29/2013, a valiant effort was made to reclaim those price levels approximately one week later, but to no avail.
The current market participants have been merely involved since the first of Dec'13. What we need here is commitment -- the Bulls need to show they are committed to holding these price levels and moving this market higher to close out the year. If not, the bears will surely smell weakness and begin to make a case for lower price levels.
As I've laid out in my Trader Philosophy tab on this site, "Bears will enter the market when they see the commitment level of bulls waning..." Failed accumulation at tops or failed accumulation at bottoms, either scenario, bears look for opportunities to exploit disappointment at failed accumulation. Bears are opportunists and cannot cause a bear market. The entire thought process has to change from greed to fear before the bulls let go of their positions.
Current price levels present a delicate place for any weakness. On the daily chart in the S&P 500 (SPX), momentum oscillators are showing differing signals, which makes this area even all the more "trickier". Utilizing multiple time-frame analysis on Friday enabled traders to see the BUY divergence as price made an attempt at a base building effort on the Hourly chart. The price-momentum BUY divergence was spotted on the 10-Minute chart, which suggested a higher move today (Monday). However, in today's trading session there simply was no follow-thru or commitment (there's that word again) by the Bulls to move price higher. Markets gapped up in the early session and then began to drift lower into the afternoon session. The momentum oscillators don't look favorable for higher prices. Simply put, there MUST be a show of commitment by the Bulls here to maintain price above $176.50 in the SPY ($1763 in SPX) or the Bears will demonstrate their opportunistic behavior. Should be fun to watch (unless one is on the wrong side of the trade).
*** Names to Trade - THESE ARE SHORT TERM TRADES *** Typically 1-day to 1-week:
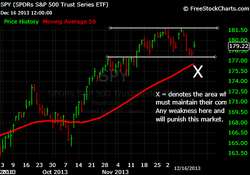
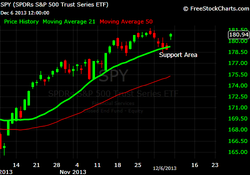
$SPY: price was unable to recover the trading area of $179.90, which is the resistance formed by the 8-Day MA and 21-Day MA. The CCI on the Daily chart reflects BUY divergence. The RSI reflects a possible bounce off the 50-Day MA "area", but price looks weak.
BIAS: Neutral
BIAS: Neutral
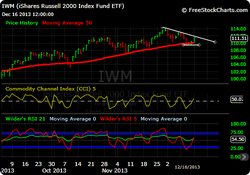
$IWM: there appears to be a distribution phase since the all time high of $114.61 on 11/29. However, price managed to hold the 50-Day MA and is now trading above the measure. Price needs to clear the distribution points marked by the downward trendline, with the most recent point at $111.57.
BIAS: Neutral
BIAS: Neutral
 RSS Feed
